Customer Value Dashboard
An interactive Tableau dashboard answering one question: who are our most valuable customers, what do they buy, and how do they compare with everyone else?
Summary
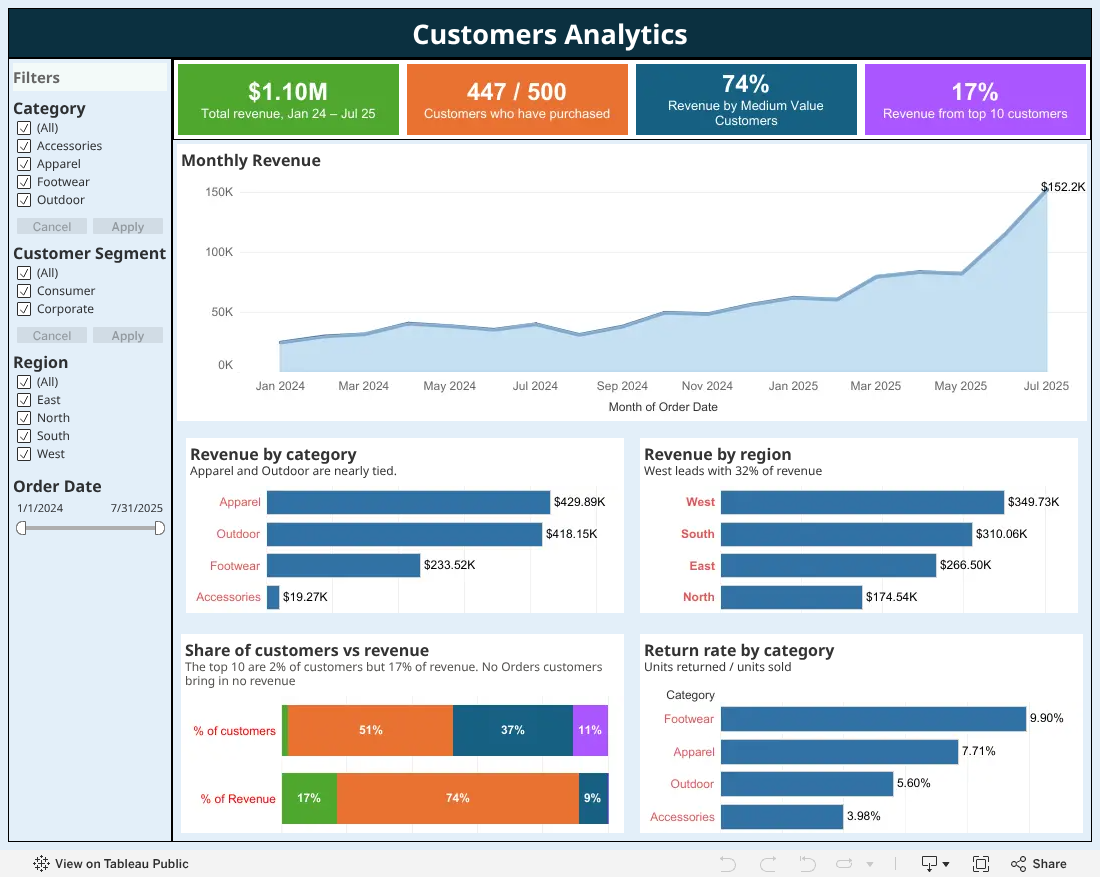
This dashboard is the visual companion to my SQL Customer Value Analysis. The data was prepared and the customers segmented in SQL (DuckDB), then brought into Tableau to build one interactive page. A manager can see revenue, growth, customer value and returns at a glance, and filter everything by category, customer type, region, and date.
Data
A retail sales dataset of five related tables (customers, orders, order items, products, returns) covering 500 customers and 3,000 orders from January 2024 to July 2025. Two tables were prepared in SQL for Tableau:
- sales_lines: one row per order line (6,698 rows), already joined to its customer, product, revenue, and units returned.
- customer_segments: one row per customer (500 rows) from the final SQL query, with order history, revenue rank, share of revenue, and a value segment (Top 10, Medium Value, Low Value, No Orders).
The two are linked with a Tableau relationship on customer_id, so customer filters apply across the whole dashboard. The 53 customers who never ordered stay in the customer counts.
Approach
- KPI cards: total revenue, customers who purchased (447 of 500), revenue share of the Medium Value segment, and of the top 10 customers. The revenue card's date caption is built from
MIN/MAXof order date, so it updates with the filters. - Monthly revenue: a continuous-month area chart, drawn as an area and a line on synchronized axes so they can have different colors.
- Segment comparison: a 100% stacked bar comparing each segment's share of customers with its share of revenue. It uses LOD expressions, for example
COUNTD([customer_id]) / MIN({FIXED : COUNTD([customer_id])}), with the filters added to context so the shares stay correct when filtered. - Return rate:
SUM([returned_quantity]) / SUM([quantity]), summed before dividing so the rate is correct at every level. - Filters: category, customer segment (Consumer / Corporate), region, and an order-date range.
Key Insights
- Revenue is accelerating. Monthly revenue grew from about $25K in January 2024 to $152K in July 2025. The five best months were all in 2025, and June 2025 had the largest month-over-month jump (+39.9%).
- Value is concentrated. The top 10 customers (2% of the base) generate 17% of revenue. The 254 Medium Value customers bring in 74%.
- Apparel and Outdoor are nearly tied (about $430K and $418K), and together make up 77% of revenue. Accessories bring in under 2%.
- West is the strongest region with 32% of revenue; North is the smallest.
- Footwear has the highest return rate at 9.9%, more than twice that of Accessories (4.0%). Better sizing guidance could reduce it.
The SQL behind every number, including all ten business questions and the customer segmentation query, is on the SQL project page.
Tools & Skills
- Tableau
- Calculated Fields
- LOD Expressions
- Table Calculations
- Dashboard Design
- Interactive Filters
- SQL (data prep)
- Data Storytelling